Laying Foundations for the Final Project

#Synthesis 6

This article lays the foundation for the scholarly material which will prove useful in the presentation of my final project for DCS 204 Data Cultures. Throughout the module, we have been presented with several concepts and methodologies when it comes to the general perceptions and preconceptions about data, its nature, its manipulation, and its flaws. Several concepts we learned about focused on the considerations we must take when working with data, even before the inception of said work. All in all, we have encountered material which has helped us sharpen the way we look at data analysis. 

For my project, I have chosen to apply those good practices in the investigation concerning the demographics of the donors to Bates College.

What is the most common demographic among the donors?

What does that tell us about the microcosm of Bates College back in the 1850s? How is this related to the silenced voices related to the Bates community?  In my project, I will attempt to answer these questions while also addressing those which come up as a corollary of this discussion. Hence, the way I present and communicate my ideas are important and, for this reason, I will implement Yau’s suggestions about “Design with a Purpose”. This theoretical framework will ensure that the voices of historically oppressed groups are put forward and not further suppressed. I will now proceed to enumerate other class materials which will prove helpful in my project. 

One of the first concepts we learned about in class was that of racial capitalism. In his presentation, Kelley  traces the origins of racial capitalism back to feudalism, racialism and nationalism which existed in Europe well before the dawn of any kind of other social economic system. He goes on to describe racial capitalism as the process of deriving social and economic value from the racial identity of another person based on a White-favored hierarchization of race and ethnicity. Said hierarchization was used to justify the various social disparities among social groups and especially to uphold the marginalization and exploitation of non-Whites. This takes the form of social ostracization, slavery, and racism. In this light, how is racial capitalism reflected in the data we studied and, more specifically, in the demographics of Bates’ donors? This is a correlation which, I believed, deserves due consideration. 

Another concept we talked about in class was that of design justice, from an article by Costanza-Chock. Most design processes today reproduce the inequalities and disparities we see in society. Design justice invites us to rethink said design processes, and to center people who are normally marginalized by design. The application of  this principle consists in the examination of data in a fashion which aims at  empowering underrepresented groups with the active acknowledgement that capitalism is inextricably tied to racial and gender dimensions. This is, to me, the most relevant tool in analyzing the data in my project, mostly because of the nature of its nature. The data about the donors and about the inception of Bates has been recorded by White and privileged people and they have chosen to only keep their fellow White and privileged contributors in the history of Bates College.  Design justice becomes crucial in dismantling this ideology since we want to restitute their weight and impact to the communities which have been silenced for centuries, in this case,  the Lewiston-Auburn community.
Synthesis #5

This week, we learn to implement and interpret chi-square tests, t-tests and regressions in R. Below is an example of the t-test we performed for this week.

First, we loaded the data set which consisted of donors and information about them.

donors <- read.csv("MSS_donors_all.csv")
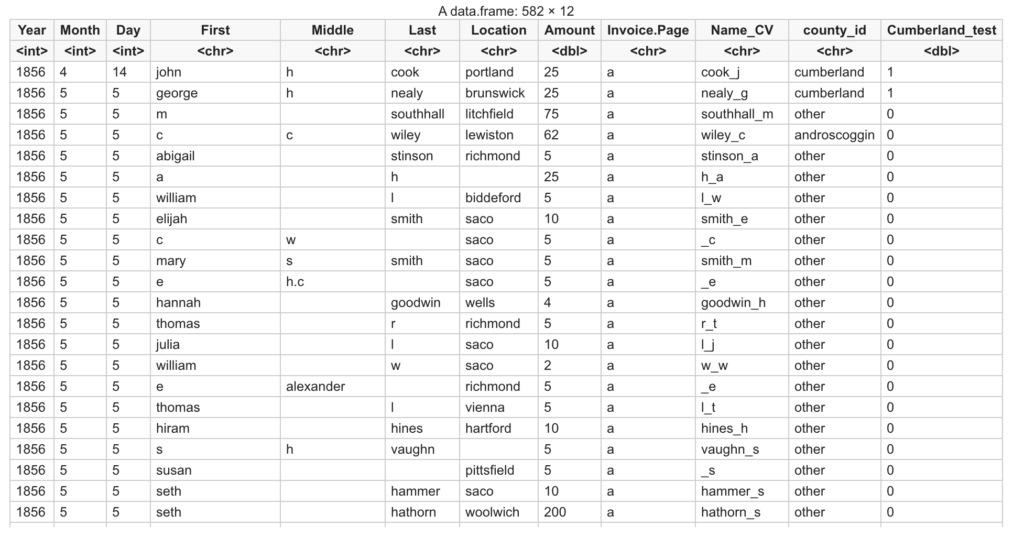
This is an extract of our data frame.

We then subsetted the donors data frame into two vectors – one called cumberland_donoations_amt containing donations from Cumberland and one called androscoggin_donations_amt containing donations from Androscoggin. This was accomplished using the code below.

cumberland_donations_amt <- donors[which(donors$Cumberland_test == 1),]
androscoggin_donations_amt <- donors[which(donors$Androscoggin_test == 1),]

We effectuated the t-test using the following code:

t.test(cumberland_donations_amt$Amount, androscoggin_donations_amt$Amount)

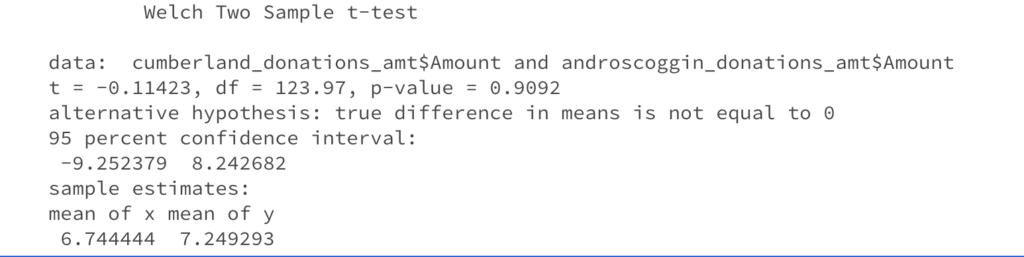
And it yielded the following results:

The p-value is 0.9092 and, since the confidence level is 95%, α = 1- 0.95= 0.05. Since 0.05 < 0.9092, the p-value is greater than α. We need to reject the alternative hypothesis and keep the null hypothesis.

________________________________________________________________________

For my project, I had initially chosen the question: “Where did the money come from?“

I was mostly motivated to investigate the following questions: what were the occupations of the donors? Where did they live? How did they make their money? Did they come from families of enslavers? How wealthy were they?  

My initial plan to answer these questions consisted in obtaining more records and archives from the time period in question, and other qualitative ways to investigate the donors’ generational wealth, for example. Hence, I wanted to use quantitative records such as tax records and financial records and qualitative ones such as newspapers or other historical journals. 

After collecting the data,  I would have put it in a readable and understandable format by tabulating the results on histograms or scatter plots mostly to notice correlations between, for example, the donors’ professions and the amount of their donations, or the amount of donations and whether these donors made money through slavery plantations. My question would then investigate the percentage of the total amount of money Bates received stemmed from slavery.

During our group discussion, I realized a number of limitations in my approach which have pushed me to reconsider my initial question. Firstly, it is quite impractical to retrace the wealth of any given family since most of this information would be confidential and not readily available for most of them. Also, another source for the impracticality would be to distinguish how the money they had is related to slavery. To the exception of directly owning a cotton-picking company, there are not a lot of scenarios for occupations for which we can assume a direct link to slavery (although we can speculate).

Hence, I have opted to choose a less intricate question which is  “what is the most common demographic among the donors?” Through this question, I will analyze the already existing data we have from the Maine State Seminary and find the most recurrent characteristics and traits of the most influential donors from our dataset. 

I pause here to talk about the most marking concept I learned about this week – that of design justice. The application of  this principle consists in the examination of data in a fashion which aims at  empowering underrepresented groups with the active acknowledgement that capitalism is inextricably tied to racial and gender dimensions. This is, to me, the most relevant tool in analyzing the data and occurrences we do in this class, mostly because of the nature of what we are studying. The inception of Bates has been recorded by White and privileged people and they have chosen to only keep their fellow White and privileged contributors in the history of Bates College.  

Design justice becomes crucial in the dismantling this ideology since we want to restitute their weight and impact to the communities which have been silenced for centuries, in this case, the the Lewiston-Auburn community. Another concept we encountered this week is that of the matrix of domination and how it plays in the understanding of the discourse towards the promotion of a more just society unbiased in terms of gender, race, and class. As an example of its application, we would need to start by acknowledging that the data describing the financial records linked to Bates and its inception, especially the one related to Benjamin’s Bates’ cotton industry, fails to acknowledge that the money they made came from the sweat and blood of enslaved people. This is one of the many realities which have been erased in the collection and presentation of this data and we need design justice to help heal and empower the communities it affects. 

When it comes to the application of design justice in my project, I will highlight that all the donations I will be analyzing do not reflect the contribution of people from historically silenced communities to the establishment and construction of the college. Hence, through my project,  I want to show that the contributors who were chosen to remain in the historical records are in majority or exclusively White and privileged. 

Synthesis #4

More than a century and a half ago, Bates College was birthed from the will and devotion of people who deemed that a college in Lewiston-Auburn would greatly benefit the advancement of society. It is quite fascinating, when you come to think of it, that the construction of a college be the intersection between people’s vision for a better future and the means they had at that time to concertize an idea of such a scope. As such, the vision which Benjamin Bates and Oren Cheney had back in the 1850s was brought to fruition with the material means which donors provided them with. With this in mind, we can rephrase our opening statement in the following fashion: more than a century and a half ago, Bates College was birthed from the monetary donations of donors. 

It goes without saying that, had these donations not occurred when they did, because of any justifiable reason, the college as we know it today would probably not be standing. It is only natural that we might want to investigate the actual reasons behind the donors motivations to donate to the college or the circumstances under which they effectuated these donations. Other relevant tracks of investigation might also be to find out who these donors were and what their relationship to Bates were after they had donated the money. However, there is a question which, to me, encompasses or supersedes all the others due to its multi-layered and convoluted nature.

Where did the money come from?

The corollaries which flow from this one monumental question are quite numerous. What were the occupations of the donors? Where did they live? How did they make their money? Did they come from families of enslavers? How wealthy were they?  

In a practical sense, we would answer these questions, by obtaining more records and archives from the time period in question, but we would also want to go even further in time if the donations are suspected to come from the donors’ generational wealth, for example. Quantitative records such as tax records and financial records from the towns from which the donors were from would be good starting points. However, qualitative data would also prove useful in this endeavour by providing us with more qualitative context. Newspapers or journals would be invaluable sources of information especially if we find our quantitative resources to be limited in the information they tell. 

After the process of data collection, we would benefit in putting the information in a readable and understandable format. I am thinking of tabulating these results on histograms or scatter plots. This would help us greatly in the analysis we would want to undertake, especially if we want to notice correlations between, say, the donors’ professions and the amount of their donations, or the amount of donations and whether these donors made money through slavery plantations. 

In a broader sense, I want to find out what percentage of the total amount of money Bates received stemmed from slavery. However, I recognize that due the fact that much of the information needed to answer this question might not be available or, if available might be extremely costly or time consuming to process. Hence, we might need to use a sample of donors instead of the whole population of donors to perform our analysis. In choosing our sample and in the process of sorting through the data, it will be crucial to apply the many principles we have learned about in this class. I am thinking about the considerations put forward by Muñoz and Rawson in particular.

Synthesis #3

“The archive conceals, distorts and silences as much as it reveals…”

This week I learned to apply exploratory data analysis in my understanding of the course material. More specifically, I learned to manipulate data frames and 2D data structures and to subset data frames. We also learned about how to produce and read scatterplots to investigate possible correlations between the elements in our observations. These are very helpful tools when we want to get a sense of the trends happening with the data we are working with. To be able to represent data through visualizations lets us save time.  

I always knew that there is a certain amount of caution that should come with reading historical facts and analyzes, but I never understood the underlying reasons why. This week, I understood that since data is not neutral and naturally occurring, it cannot be objective. In fact, we learned that it is very subjective, especially since it is subjected to many human biases. We pondered about this occurrence only to realize that, oftentimes, quantitative data has been manipulated to erase history or to paint a picture that is not the most accurate about the situation it aims at describing – to paint a story which aligns more with the narrative we want to show to the world. This is where the need for reparation comes in. I realized this when reading the article ‘Cotton Comes to Harvard” by Wilder about Harvard’s perverse relationship with the money it received . The following question arises: how do we ensure that quantitative data does not become a flawed representation of the past? The ugly truth is that a number of universities in the US benefited from donations from rich white men who earned money on the back of the people they enslaved.  The fact that these schools choose how to tell the story of their past is utterly abject and untruthful – the past cannot be narrated with half-truths and disguised lies. When we come to think of it, Bates is not that different from Harvard. For Bates and Harvard to call themselves ‘abolitionists’ and to extrapolate this part of their story when, in reality, they have condoned the acts of enslavers is an act of deception. Hence, data analysis should be a tool to help dismantle the lies, not to uphold them.  It becomes clear that there is much work to be done in terms of authentification of already existing records not only to investigate their degree of veracity, but to account for what they do not tell as well.

This week, we learned a great deal about Bates’ past. More specifically, we analyzed data from donations made to the college during the late 1850s. The data we analyzed is from the Maine State Seminary and displays a record of donors. Other pieces of information we are given are the date of the transaction and the amount. In most cases, donors are identified by their first and last names.

plot(data$Day, data$Amount) 
#This will plot the amount in dollars on y-axis
#and day of the month on x-axis

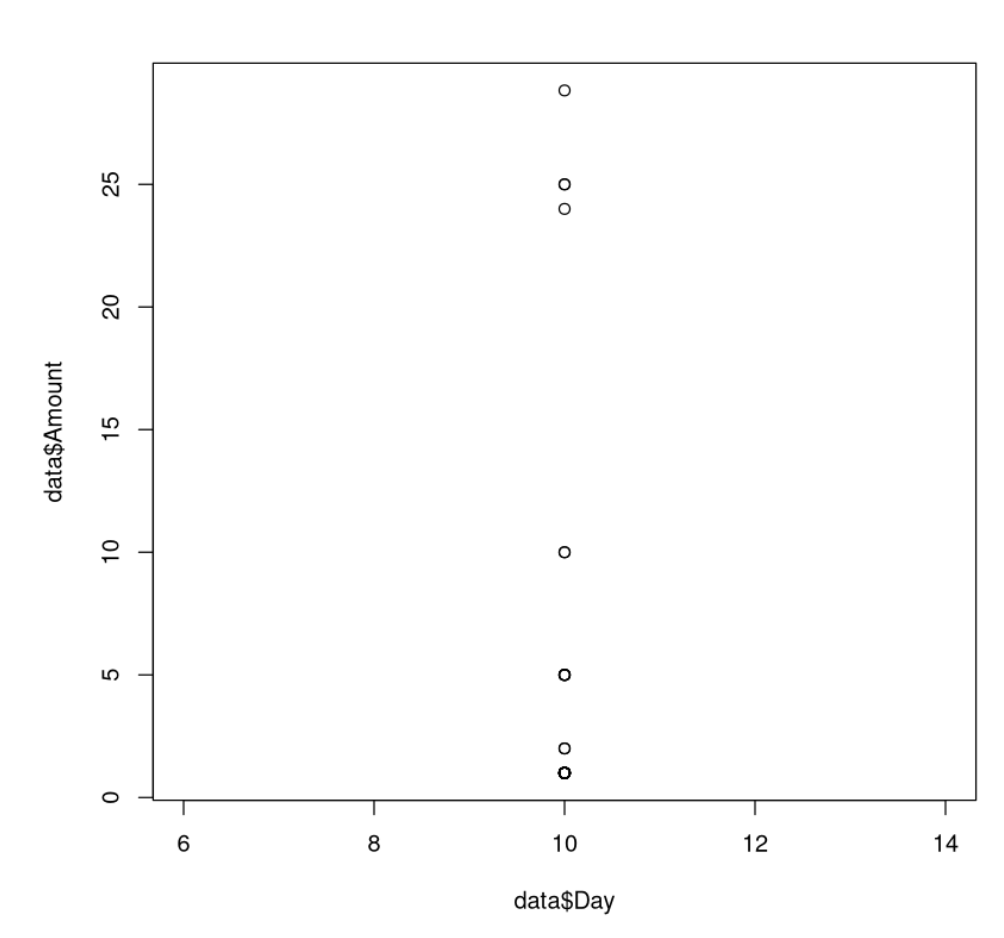
Consider the following scatter plot which has been produced using the code above. When using scatter plots, we aim at finding if there is a pattern in the data we are analyzing. Here, we have a display of the amount of the donations and the day of the month on which they occurred.

We see that all of the donations took place on the 10th of that month, which turns out to be August. Normally, we would use the code below to investigate a correlation between the two parameters.

cor(data$Day, data$Amount) 

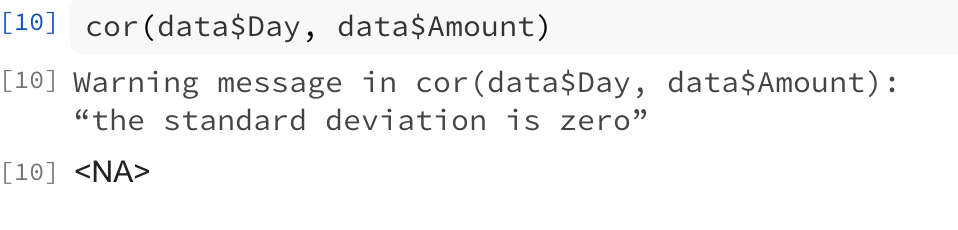
However, since all the transactions happened on the same day, such a calculation is vain, as shown below.

We might want to investigate what happened on that 10th of August 1857 to explain why all of these transaction happened on that very day. In this particular case, we cannot deduce a substantial correlation besides the one we just noticed. To quote Marisa Fuentes, “the archive conceals, distorts and silences as much as it reveals.” This is a clear example of this. Although we have records of names and donations, they do not explicit tell us where the money they contributed comes from. This is an information we would greatly benefit from especially in the discourse about Bates’ financial past.

Synthesis #2

100,104.96… , 4171.04…. , 11.4…

This week, I learned about indexing, subsetting and logical operators in R, and how to implement all of these features. I also learned how to represent statistical data on R using visualizations such as histograms. It goes without saying that R is great for calculating statistical concepts such as the mean, standard deviation, and max & min values. In addition, we expanded on the fact that the data we encounter is never neutral or naturally occurring and that, because of this, data analysis can be a powerful tool, especially for those already in a position of power. This is where Robin Kelley’s argument comes into play. Learning about the concept of Racial Capitalism was eye opening. Kelley pushes the ideas of Marx and, not only adds the element of race in the equation, but proves that that very element is actually at the source of capitalist inequalities. Hence, Kelley heavily critiques Marx in his overlooking of this primordial component. The reason why I am mentioning Marx through this reading is to support the following argument. 

Data Analysis is an ideological state apparatus. When we come to think about it, Marx’s ideas can still be contextualized to analyze some of today’s establishment. For Marx, an ideological state apparatus denotes institutions such as education, religious organizations, the family, the media, trade unions, and law, which are formally outside state control but which served to transmit the values of the dominant ideology, to interpellate those individuals affected by them, and to maintain order in a society, above all to reproduce capitalist relations of production. It is also used to justify inequalities between classes and different social groups. 

In the reading about data feminism, there is a clear example of how data analysis is used to uphold the ideals of the dominant male patriarchal status quo. Data in the hands of straight white males has contributed to the upholding of a system of oppression against women for way too long. We thus understand how crucial data feminism is in the context of the fight for gender equality and the dismantling of predominantly male dominated fields. This idea is lacking if not implemented with an emphasis laid on intersectionality. Dimensions such as race, class and ability cannot be overlooked.

This week, we also learned to generate useful and meaningful information from existing data. In an attempt to produce such information, I will now perform an analysis based on the invoices we studied in class.

Historians estimate that one enslaved people would pick an average of 150 pounds of cotton a day. Using this information and the invoices from the archives, we can estimate how many days it took to pick the cotton. In other words, how many days were stolen from the enslaved people who were forced to pick the cotton.

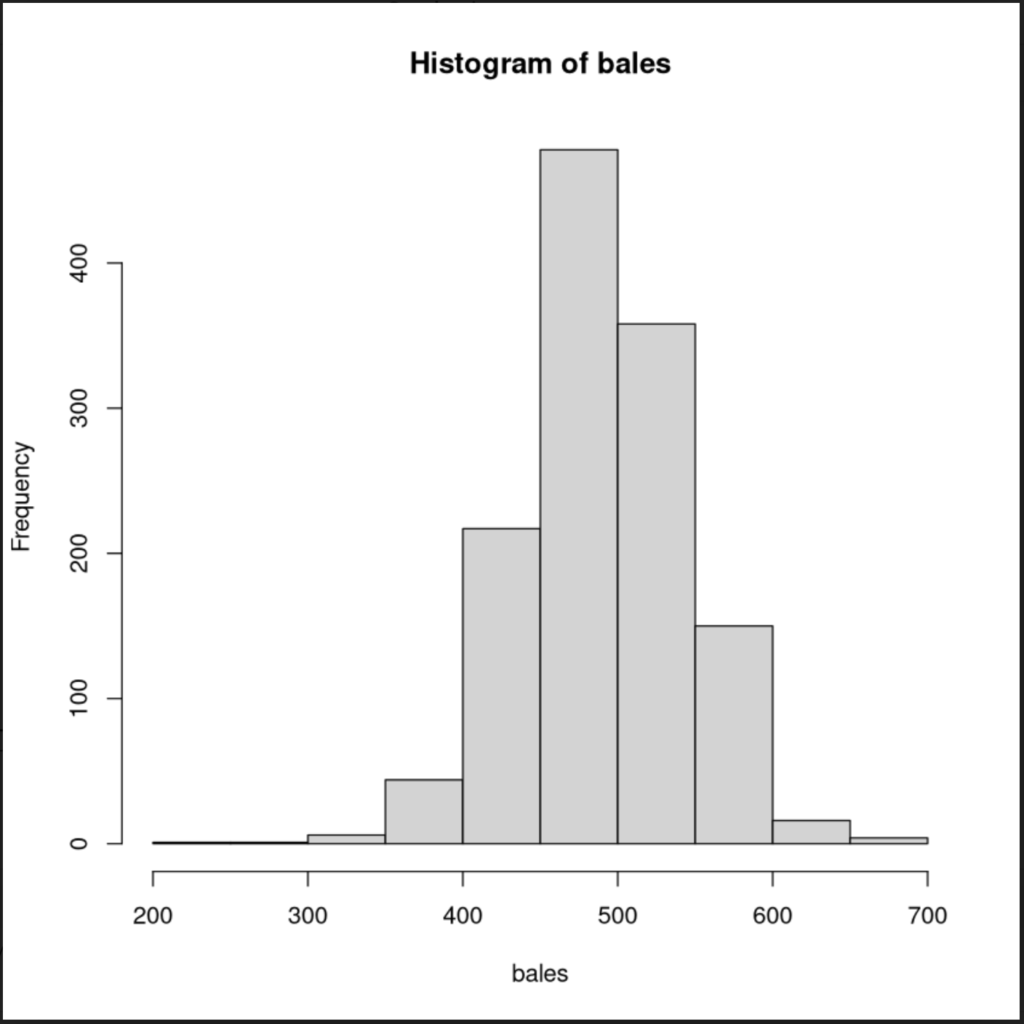
The first histogram shows how many pounds of cotton were sold in the bales.

Weight of Cotton

We see that between bags of 300 to 700 pounds of cotton were sold in each bale. The following operation lets us know that the average weight of each bag is 490 pounds.

bales <- c(bales_1, bales_2, bales_3, bales_4, bales_5, bales_6, bales_7, bales_8, bales_9, bales_10, bales_11, bales_12, bales_13, bales_14, bales_15 )
mean(bales) 

The total weight of the cotton in all the bales is 625656 pounds. This information is given by the code below.

bales <- c(bales_1, bales_2, bales_3, bales_4, bales_5, bales_6, bales_7, bales_8, bales_9, bales_10, bales_11, bales_12, bales_13, bales_14, bales_15 )
sum(bales)

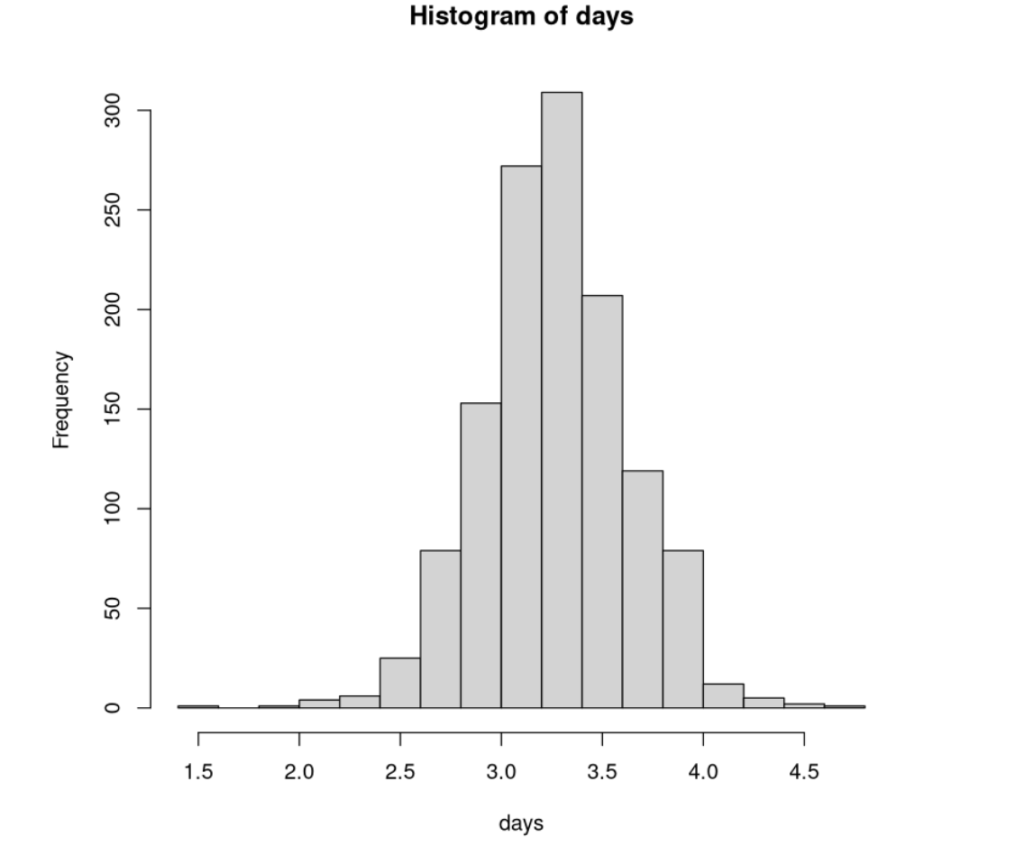
The histogram below shows the number of days it took to collect the cotton. On average, it took 3.27 days for one enslaved person to collect on bag of cotton.

bales <- c(bales_1, bales_2, bales_3, bales_4, bales_5, bales_6, bales_7, bales_8, bales_9, bales_10, bales_11, bales_12, bales_13, bales_14, bales_15 )
days <- bales/150
sum(days)

In the code above, we added the weight of cotton from all the bales and then divided the result by 150 (the average weight of cotton collected in a day). Then we added all these days together. We find out that the total number of time stolen from the enslaved people to produce the cotton on these invoices is 4171.04 days.

100,104.96 hours…4171.04 days…. 11.4 years…

Synthesis #1 – Mathieu Moutou

One of the reasons why I applied to Bates was because of the emphasis that the college lays on the ‘abolitionist’ part of their presentation to the world. Coming from Mauritius, a country in which slavery is still fairly recent in the minds of its people, I greatly appreciated the idea of coming to an institution which, I thought, holds dear  the same values as I do – those being acknowledging the traumas and sequels of slavery and actively working to dismantle its sequels in modern day society. It was quite disconcerting this week to learn about the history of Bates in regard to its foundation. Learning about Cheney and Bates’ relationship with the creation of the college was a component of the class that I greatly enjoyed learning about as it helps me recalibrate my understanding of Bates, Lewiston, and the US, more broadly. 

Reading Emma Soler’s thesis chapter was very much a cathartic experience since I noticed that she bases herself off the same questions and intellectual quests as I did as a first year student but which soon vanished as I moved up the ladders of my academic career at Bates. I am grateful to be confronted with all these questions again as they had never been resolved. This week, I learned that life has its ways of answering questions you had and that those answers can and will come to you when it is time. After going through last year’s events which uncovered racial disparities in the US and after learning more about my ancestry to find out that 5 generations ago, my ancestors were slaves, I can say that I am grateful for learning about how to use data analysis to generate and establish a more truthful version of history and of reality.

This week, we learned how to read about historical articles. While I already knew some of the techniques suggested by McDaniel, I enjoyed learning about the reasoning behind the methodology he suggested. I enjoyed the idea that reading should become an active process – an invitation to engage with the author and their ideas. Most of the time, reading can be perceived as a passive process, but really indulging in what is written, in the ideas and the arguments presented to us, is one way to create atemporal intellectual discourse with people who lived before us. 

This week, I also encountered the programming language R for the first time. I learned how to get used to the Notebook environment and with some of the features of R. More concretely, I learned to assign variables and to perform some basic operations. I am curious to see what we will be using the language for and how we are going to apply our critical thinking on the findings we are about to make. Finally, I learned that the information we are presented with is not always representative of the reality it aims at describing. In the context of this class, I learned that working with data can help us control narratives.

css.php