100,104.96… , 4171.04…. , 11.4…
This week, I learned about indexing, subsetting and logical operators in R, and how to implement all of these features. I also learned how to represent statistical data on R using visualizations such as histograms. It goes without saying that R is great for calculating statistical concepts such as the mean, standard deviation, and max & min values. In addition, we expanded on the fact that the data we encounter is never neutral or naturally occurring and that, because of this, data analysis can be a powerful tool, especially for those already in a position of power. This is where Robin Kelley’s argument comes into play. Learning about the concept of Racial Capitalism was eye opening. Kelley pushes the ideas of Marx and, not only adds the element of race in the equation, but proves that that very element is actually at the source of capitalist inequalities. Hence, Kelley heavily critiques Marx in his overlooking of this primordial component. The reason why I am mentioning Marx through this reading is to support the following argument.
Data Analysis is an ideological state apparatus. When we come to think about it, Marx’s ideas can still be contextualized to analyze some of today’s establishment. For Marx, an ideological state apparatus denotes institutions such as education, religious organizations, the family, the media, trade unions, and law, which are formally outside state control but which served to transmit the values of the dominant ideology, to interpellate those individuals affected by them, and to maintain order in a society, above all to reproduce capitalist relations of production. It is also used to justify inequalities between classes and different social groups.
In the reading about data feminism, there is a clear example of how data analysis is used to uphold the ideals of the dominant male patriarchal status quo. Data in the hands of straight white males has contributed to the upholding of a system of oppression against women for way too long. We thus understand how crucial data feminism is in the context of the fight for gender equality and the dismantling of predominantly male dominated fields. This idea is lacking if not implemented with an emphasis laid on intersectionality. Dimensions such as race, class and ability cannot be overlooked.
This week, we also learned to generate useful and meaningful information from existing data. In an attempt to produce such information, I will now perform an analysis based on the invoices we studied in class.
Historians estimate that one enslaved people would pick an average of 150 pounds of cotton a day. Using this information and the invoices from the archives, we can estimate how many days it took to pick the cotton. In other words, how many days were stolen from the enslaved people who were forced to pick the cotton.
The first histogram shows how many pounds of cotton were sold in the bales.
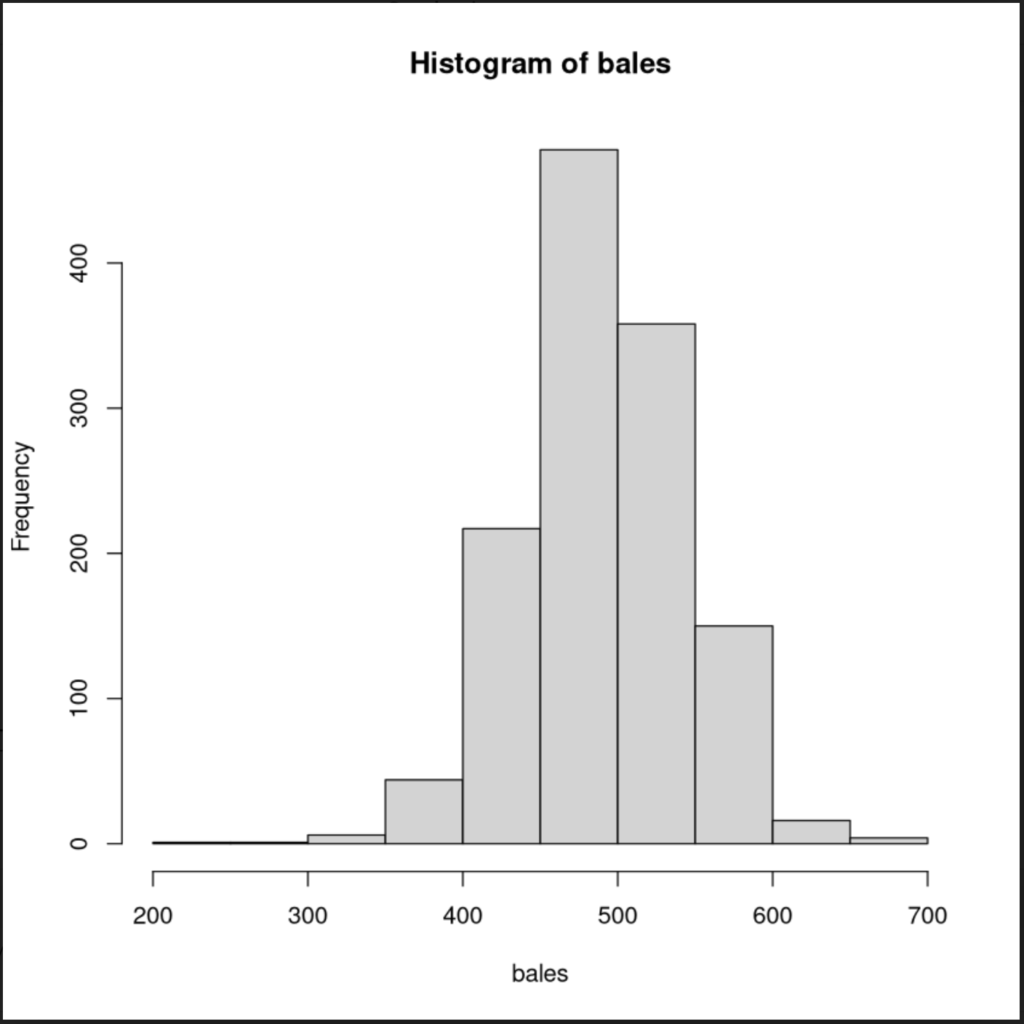
We see that between bags of 300 to 700 pounds of cotton were sold in each bale. The following operation lets us know that the average weight of each bag is 490 pounds.
bales <- c(bales_1, bales_2, bales_3, bales_4, bales_5, bales_6, bales_7, bales_8, bales_9, bales_10, bales_11, bales_12, bales_13, bales_14, bales_15 )
mean(bales)
The total weight of the cotton in all the bales is 625656 pounds. This information is given by the code below.
bales <- c(bales_1, bales_2, bales_3, bales_4, bales_5, bales_6, bales_7, bales_8, bales_9, bales_10, bales_11, bales_12, bales_13, bales_14, bales_15 )
sum(bales)
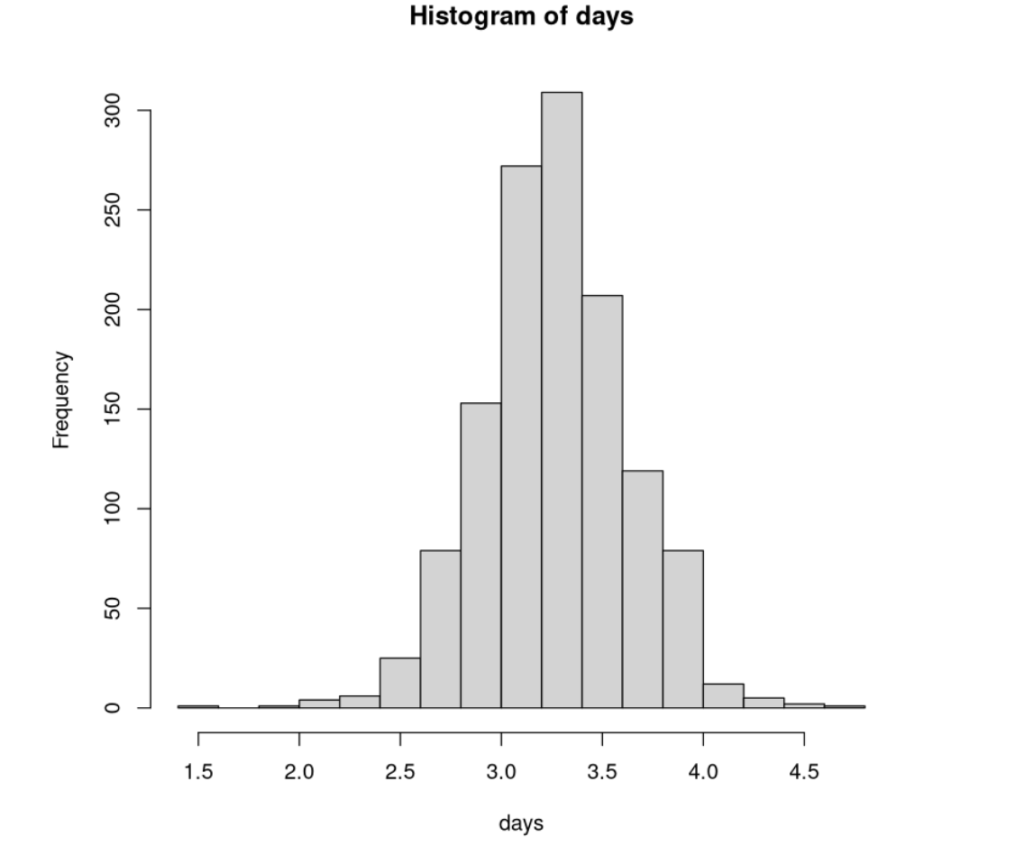
The histogram below shows the number of days it took to collect the cotton. On average, it took 3.27 days for one enslaved person to collect on bag of cotton.
bales <- c(bales_1, bales_2, bales_3, bales_4, bales_5, bales_6, bales_7, bales_8, bales_9, bales_10, bales_11, bales_12, bales_13, bales_14, bales_15 )
days <- bales/150
sum(days)
In the code above, we added the weight of cotton from all the bales and then divided the result by 150 (the average weight of cotton collected in a day). Then we added all these days together. We find out that the total number of time stolen from the enslaved people to produce the cotton on these invoices is 4171.04 days.
100,104.96 hours…4171.04 days…. 11.4 years…
