This week, we learn to implement and interpret chi-square tests, t-tests and regressions in R. Below is an example of the t-test we performed for this week.
First, we loaded the data set which consisted of donors and information about them.
donors <- read.csv("MSS_donors_all.csv")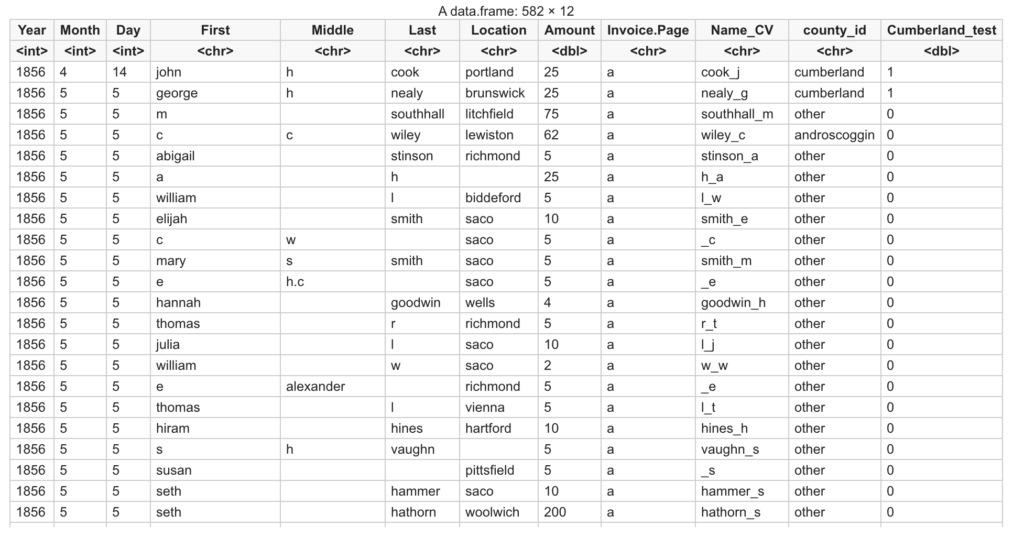
We then subsetted the donors data frame into two vectors – one called cumberland_donoations_amt containing donations from Cumberland and one called androscoggin_donations_amt containing donations from Androscoggin. This was accomplished using the code below.
cumberland_donations_amt <- donors[which(donors$Cumberland_test == 1),]
androscoggin_donations_amt <- donors[which(donors$Androscoggin_test == 1),]
We effectuated the t-test using the following code:
t.test(cumberland_donations_amt$Amount, androscoggin_donations_amt$Amount)And it yielded the following results:
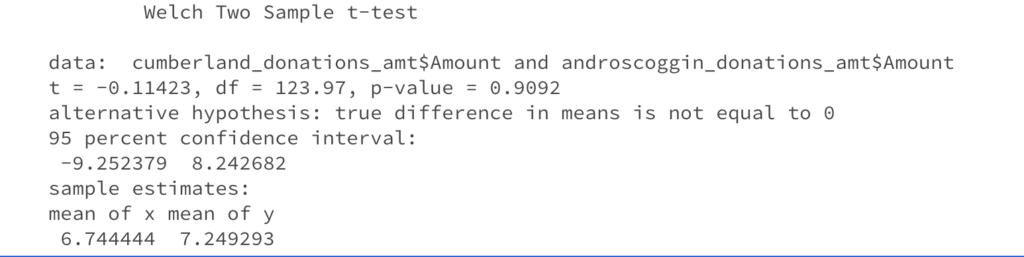
The p-value is 0.9092 and, since the confidence level is 95%, α = 1- 0.95= 0.05. Since 0.05 < 0.9092, the p-value is greater than α. We need to reject the alternative hypothesis and keep the null hypothesis.
________________________________________________________________________
For my project, I had initially chosen the question: “Where did the money come from?“
I was mostly motivated to investigate the following questions: what were the occupations of the donors? Where did they live? How did they make their money? Did they come from families of enslavers? How wealthy were they?
My initial plan to answer these questions consisted in obtaining more records and archives from the time period in question, and other qualitative ways to investigate the donors’ generational wealth, for example. Hence, I wanted to use quantitative records such as tax records and financial records and qualitative ones such as newspapers or other historical journals.
After collecting the data, I would have put it in a readable and understandable format by tabulating the results on histograms or scatter plots mostly to notice correlations between, for example, the donors’ professions and the amount of their donations, or the amount of donations and whether these donors made money through slavery plantations. My question would then investigate the percentage of the total amount of money Bates received stemmed from slavery.
During our group discussion, I realized a number of limitations in my approach which have pushed me to reconsider my initial question. Firstly, it is quite impractical to retrace the wealth of any given family since most of this information would be confidential and not readily available for most of them. Also, another source for the impracticality would be to distinguish how the money they had is related to slavery. To the exception of directly owning a cotton-picking company, there are not a lot of scenarios for occupations for which we can assume a direct link to slavery (although we can speculate).
Hence, I have opted to choose a less intricate question which is “what is the most common demographic among the donors?” Through this question, I will analyze the already existing data we have from the Maine State Seminary and find the most recurrent characteristics and traits of the most influential donors from our dataset.
I pause here to talk about the most marking concept I learned about this week – that of design justice. The application of this principle consists in the examination of data in a fashion which aims at empowering underrepresented groups with the active acknowledgement that capitalism is inextricably tied to racial and gender dimensions. This is, to me, the most relevant tool in analyzing the data and occurrences we do in this class, mostly because of the nature of what we are studying. The inception of Bates has been recorded by White and privileged people and they have chosen to only keep their fellow White and privileged contributors in the history of Bates College.
Design justice becomes crucial in the dismantling this ideology since we want to restitute their weight and impact to the communities which have been silenced for centuries, in this case, the the Lewiston-Auburn community. Another concept we encountered this week is that of the matrix of domination and how it plays in the understanding of the discourse towards the promotion of a more just society unbiased in terms of gender, race, and class. As an example of its application, we would need to start by acknowledging that the data describing the financial records linked to Bates and its inception, especially the one related to Benjamin’s Bates’ cotton industry, fails to acknowledge that the money they made came from the sweat and blood of enslaved people. This is one of the many realities which have been erased in the collection and presentation of this data and we need design justice to help heal and empower the communities it affects.
When it comes to the application of design justice in my project, I will highlight that all the donations I will be analyzing do not reflect the contribution of people from historically silenced communities to the establishment and construction of the college. Hence, through my project, I want to show that the contributors who were chosen to remain in the historical records are in majority or exclusively White and privileged.
